Click below to show tutorials for the different applications.
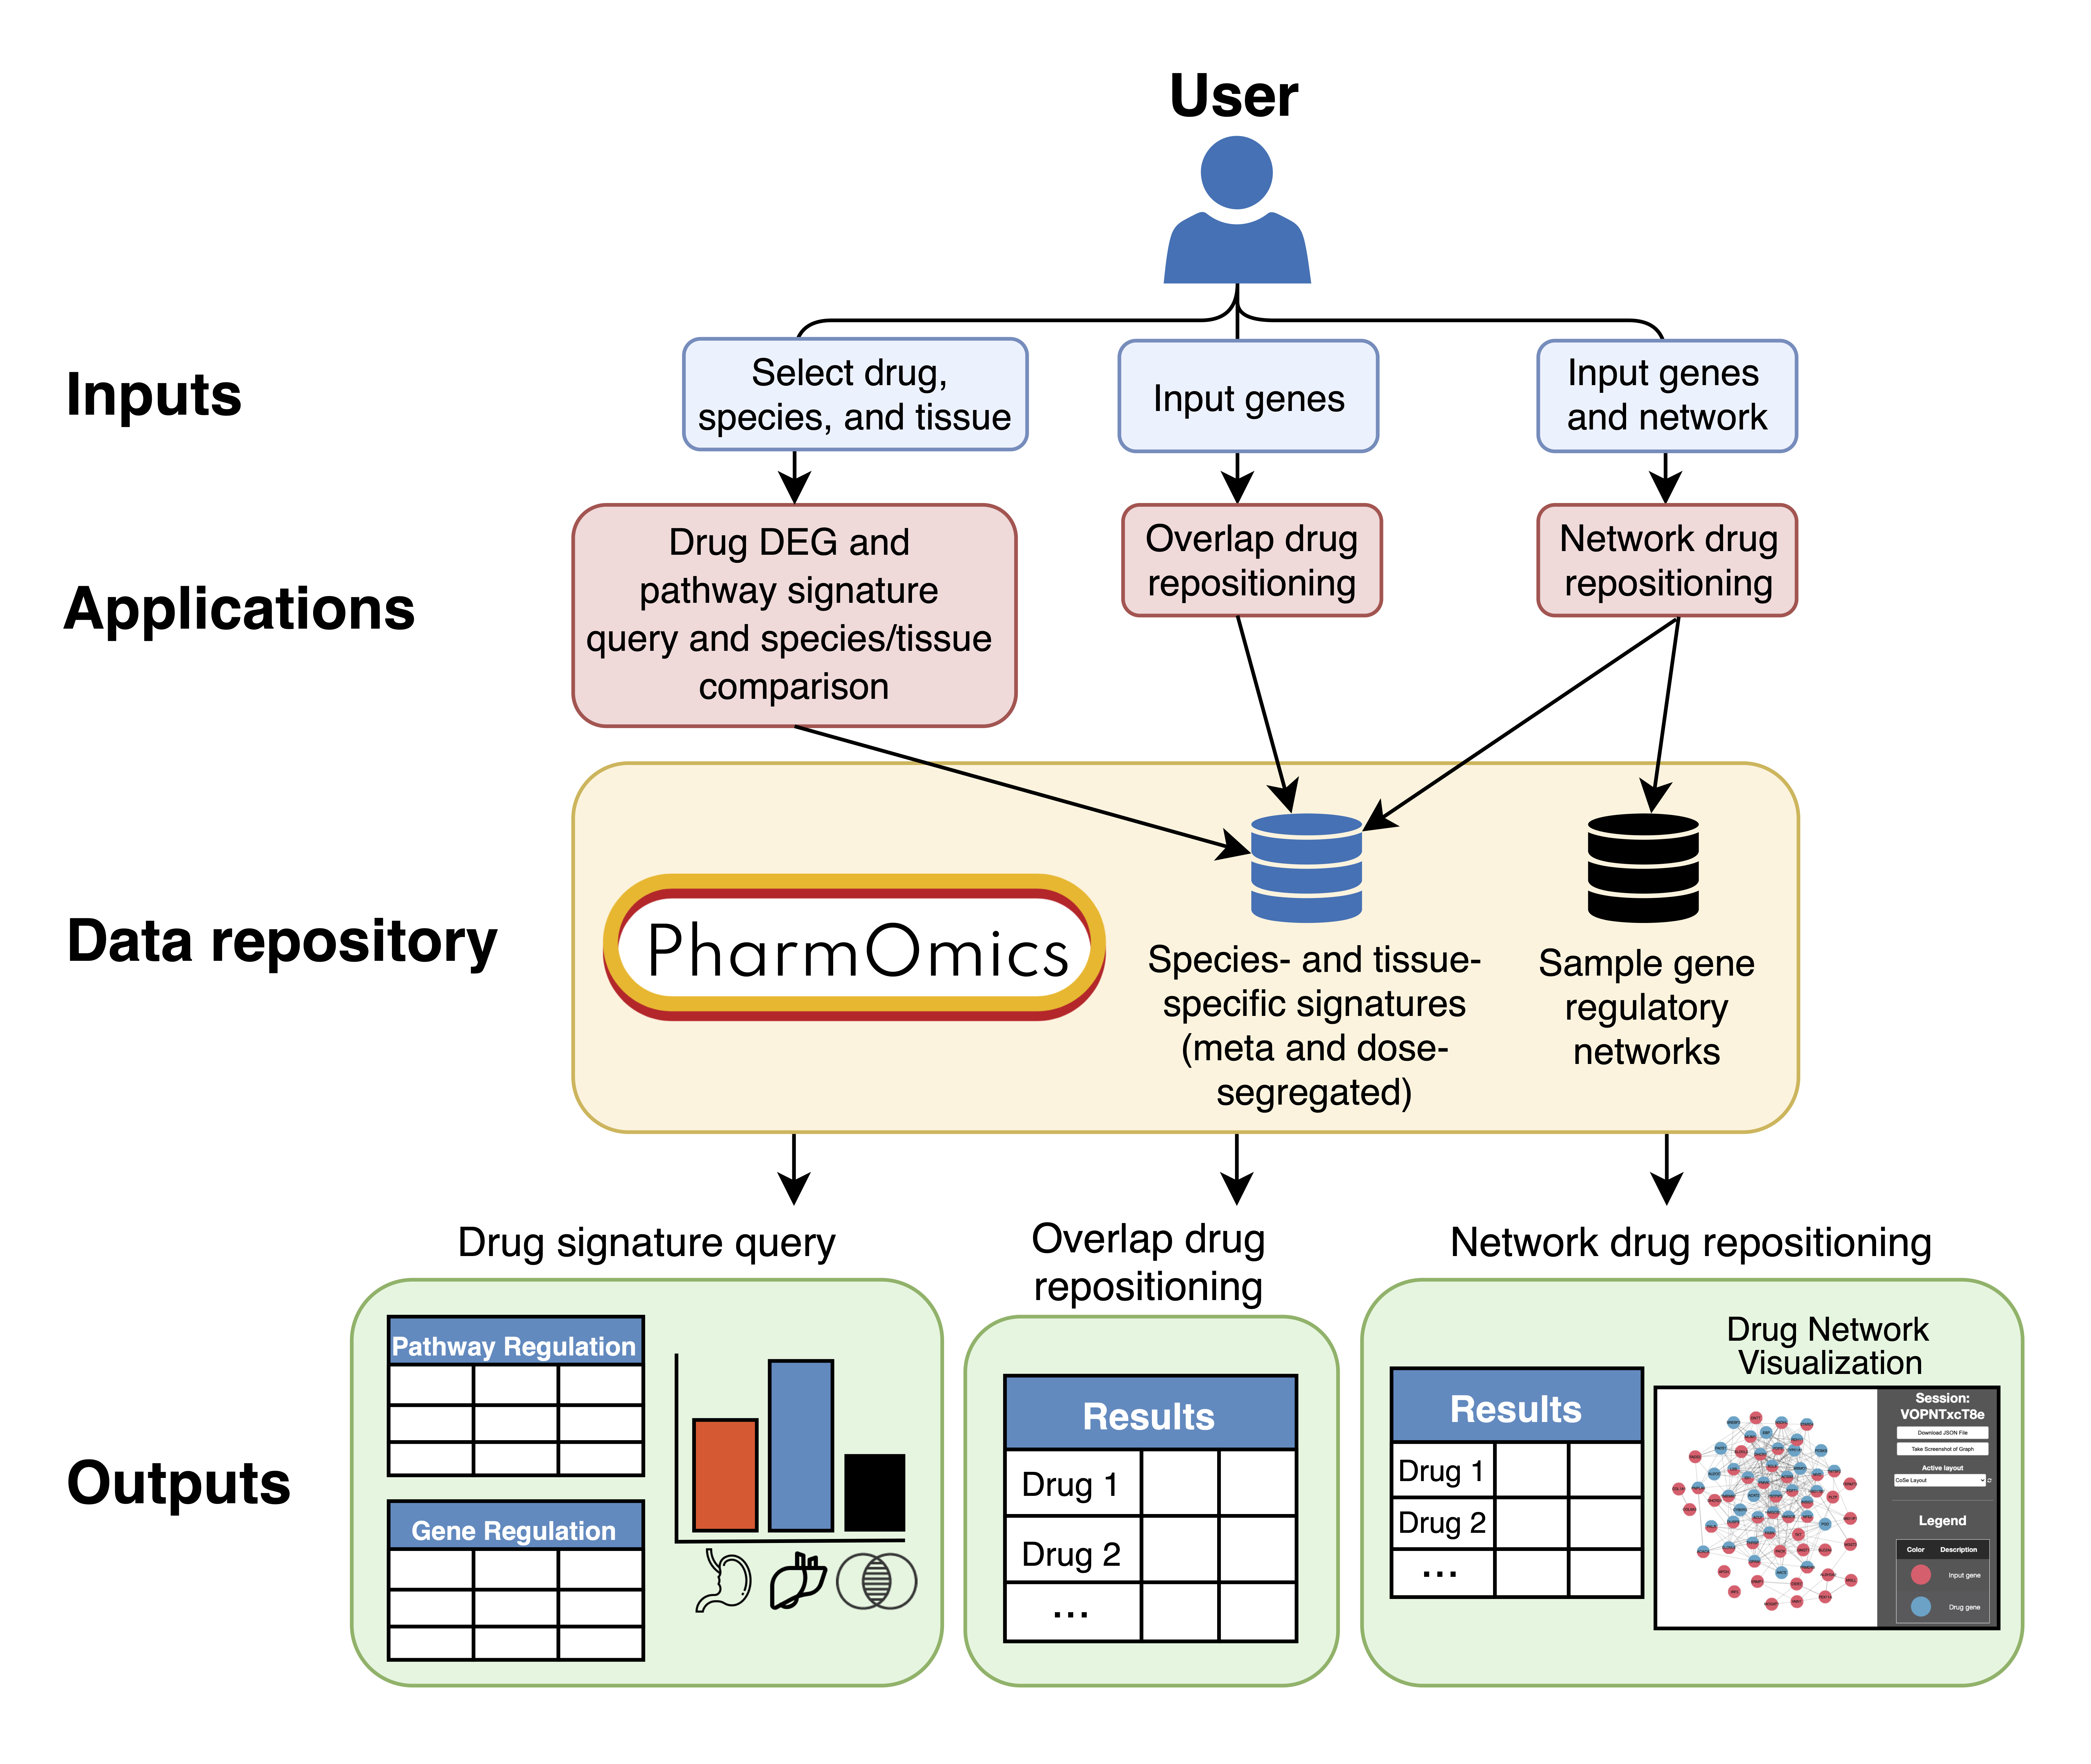
App1 displays for each drug the studies curated, differentially expressed genes (DEGs) and pathway regulation preview (top 50 DEGs and top 20 pathways) for meta-analyzed and dose/time segregated signatures and features a between-species/between-tissues DEGs/pathways comparison tool.
First, choose a drug under 'Select drug class or drug name of interest'. DEG and pathway information for that drug will appear at the bottom in the 'Gene Regulation' (shown by default) and 'Pathway Regulation' tabs. The species and tissues for which there is drug data available will also appear, and the user must click on the species and tissues to see studies curated. Full meta-analyzed and dose segregated species- and tissue-specific DEG and pathway signatures for the drug can be downloaded at the bottom by clicking on 'Download Drug Gene Signatures'.


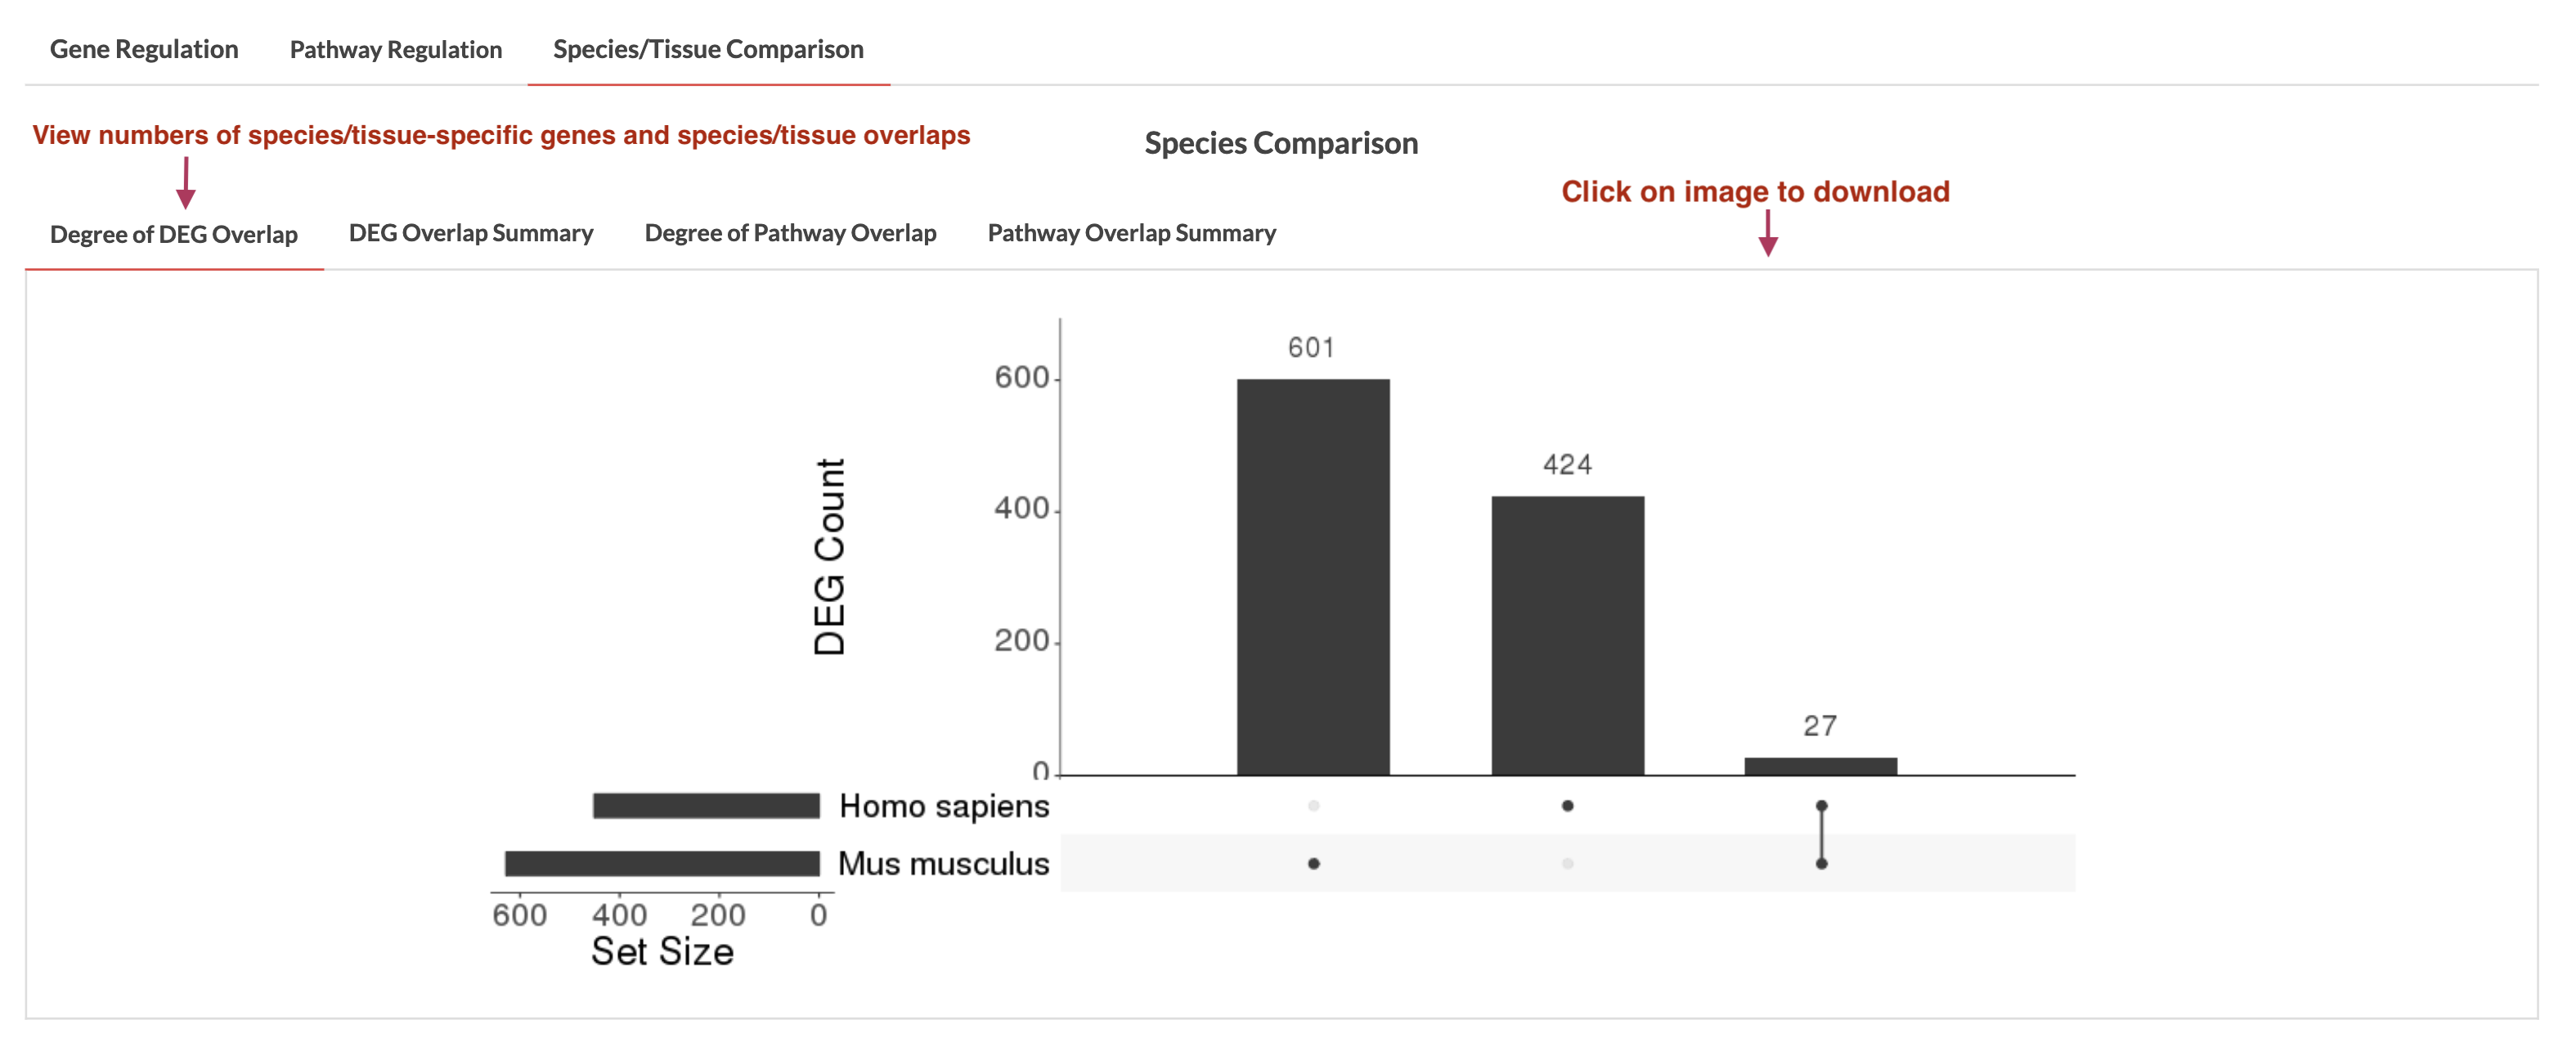
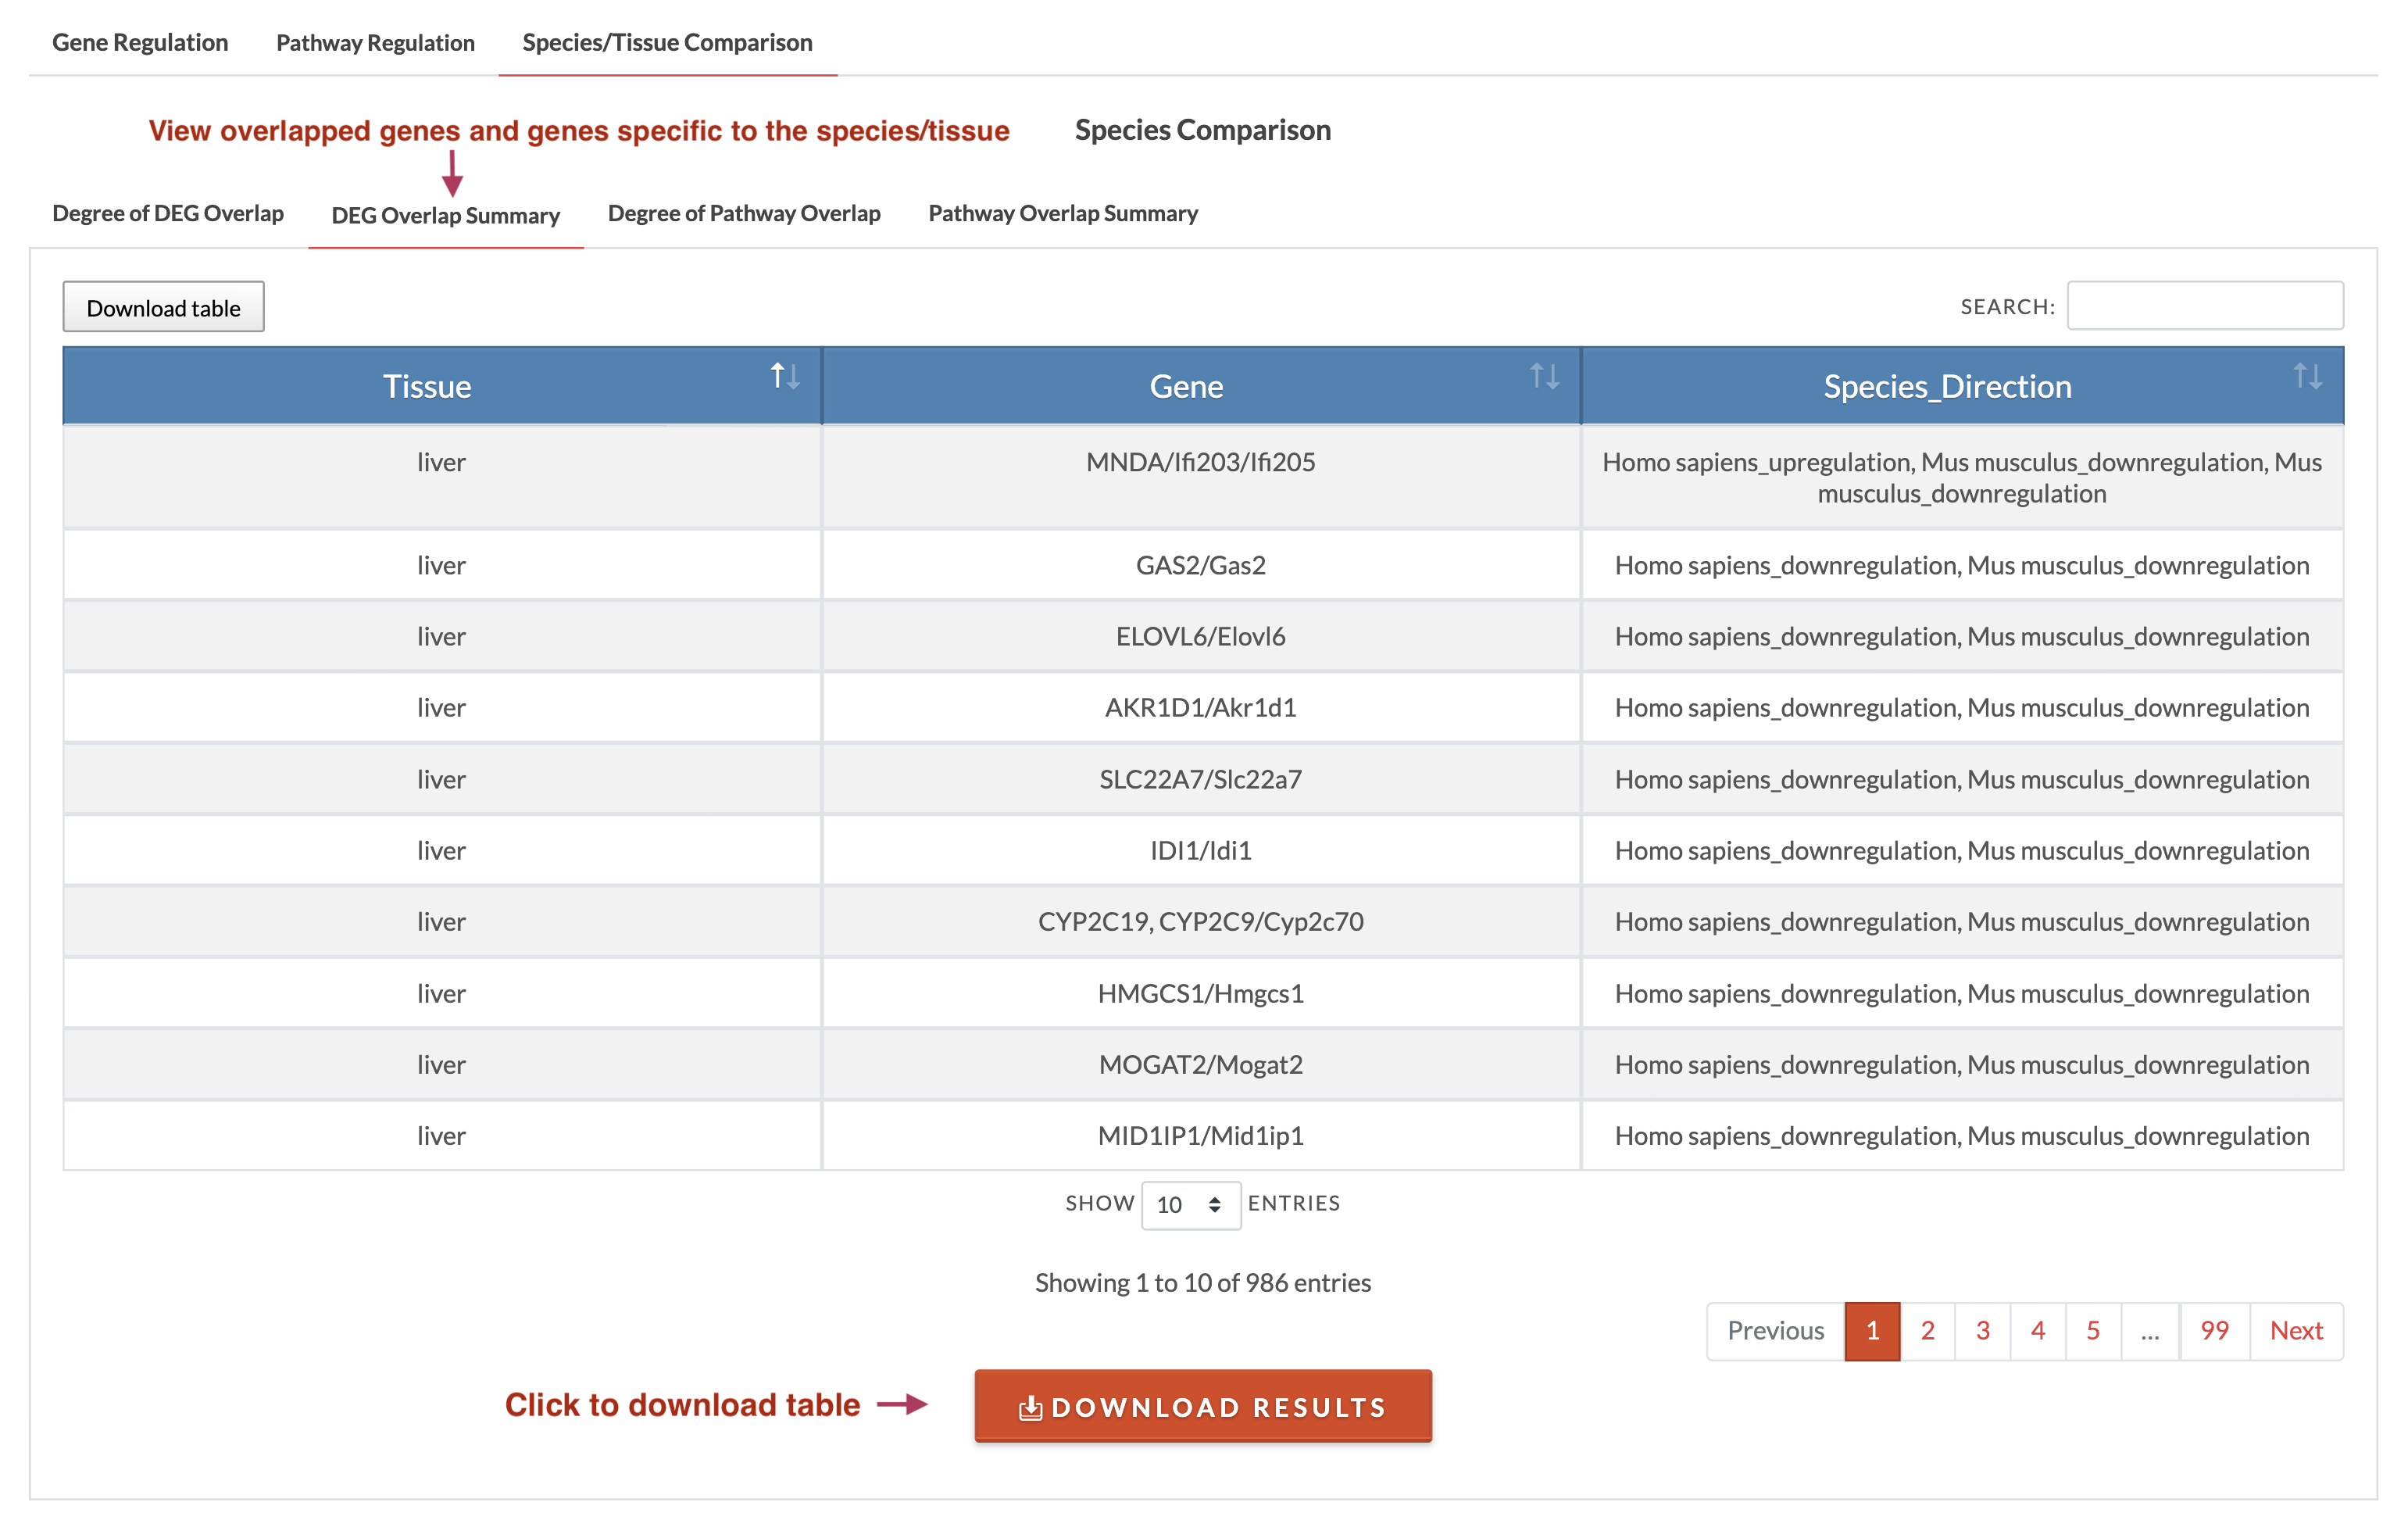
If multiple tissues and a single species are selected or multiple species and a single tissue are selected, species/tissue DEGs/pathways comparison can be run by clicking on 'Run DEGs Comparison' and 'Run Pathways Comparison'. Results will appear in the Species/Tissue Comparison tab. If there is overlap, a plot showing the counts of species-/tissue-specific DEGs/pathways and overlaps is generated in the 'Degree of DEG/Pathway Overlap' tab which can be downloaded by clicking on the plot. Regardless of whether there are overlaps, the 'DEG/Pathway Overlap Summary' shows the genes/pathways that overlapped (if any) and those specific to the species/tissue. This summary can be downloaded using the 'Download Results' button. Currently, we use meta-analyzed and limma combined data for species/tissue comparison.
1. Select signature type to query. The ToxiOmics database offers species- and tissue-specific signatures that are meta-analyzed across dose and time regimens as well as dose and time segregated signatures. Drug repositioning with meta signatures will take around 25 minutes-2 hours and is species matched (1251 human signatures and 1696 mouse/rat signatures). For dose/time segregated signatures (158 human signatures and 11,542 rat signatures), all species-specific signatures will be used for repositioning (genes will be converted to their human/rat orthologs), and the species and tissue information is retained in the results. This large dataset necessitates more computational resources; to avoid overwelming our server, we require a login for this analysis and limit the user to 5 jobs a day (login prompt will appear if a dose/time segregated signature type is selected). Running with the complete dose/time segregated signatures will take around 10 hours. The 'top 500 genes' option means that only the top 500 genes by significance per signature are considered for repositioning, and this greatly reduces computing time to around 3 hours.
2. Select or upload network. We offer sample liver, kidney, and multi-tissue gene regulatory networks. The user may upload their own network which must be a tab delimited .txt file with columns 'HEAD' and 'TAIL'. The file format will appear if the 'Upload network' option is selected. The maximum number of nodes allowed in the network is 35000. For uploading networks with a large number of unique nodes, more computing time will be needed. We are working to update and add new sample networks.
3. Select species. The species selected should match those of the input genes.
4. Input genes. Copy and paste or manually enter a gene list into the text field or drag and drop a .txt file with a single column of genes.
5. (Optional) Submit email for results to be sent to you. Enter email in the text field and click 'Send email' to receive results to your email. If you do not receive results, the email may have been sent to spam. Alternatively, enter your session ID in the ToxiOmics home session ID prompt, and the results should load if finished.
6. Run drug repositioning. Click 'Submit job' to run the analysis. A loading page will then appear. The results will automatically load once the analysis is complete. You may need to refresh the page if the time elapsed is over the estimated running time (around 25-2 hours minutes for meta signatures, 3 hours for dose/time segregated top 500 genes signatures, and 12 hours for dose/time segregated complete signatures). For meta signatures, if the job is running successfully, the progress bar will show the percentage of signatures that have been analyzed (wait a few minutes to start seeing progress). If a network was uploaded, additional time is required to build the distance matrix.

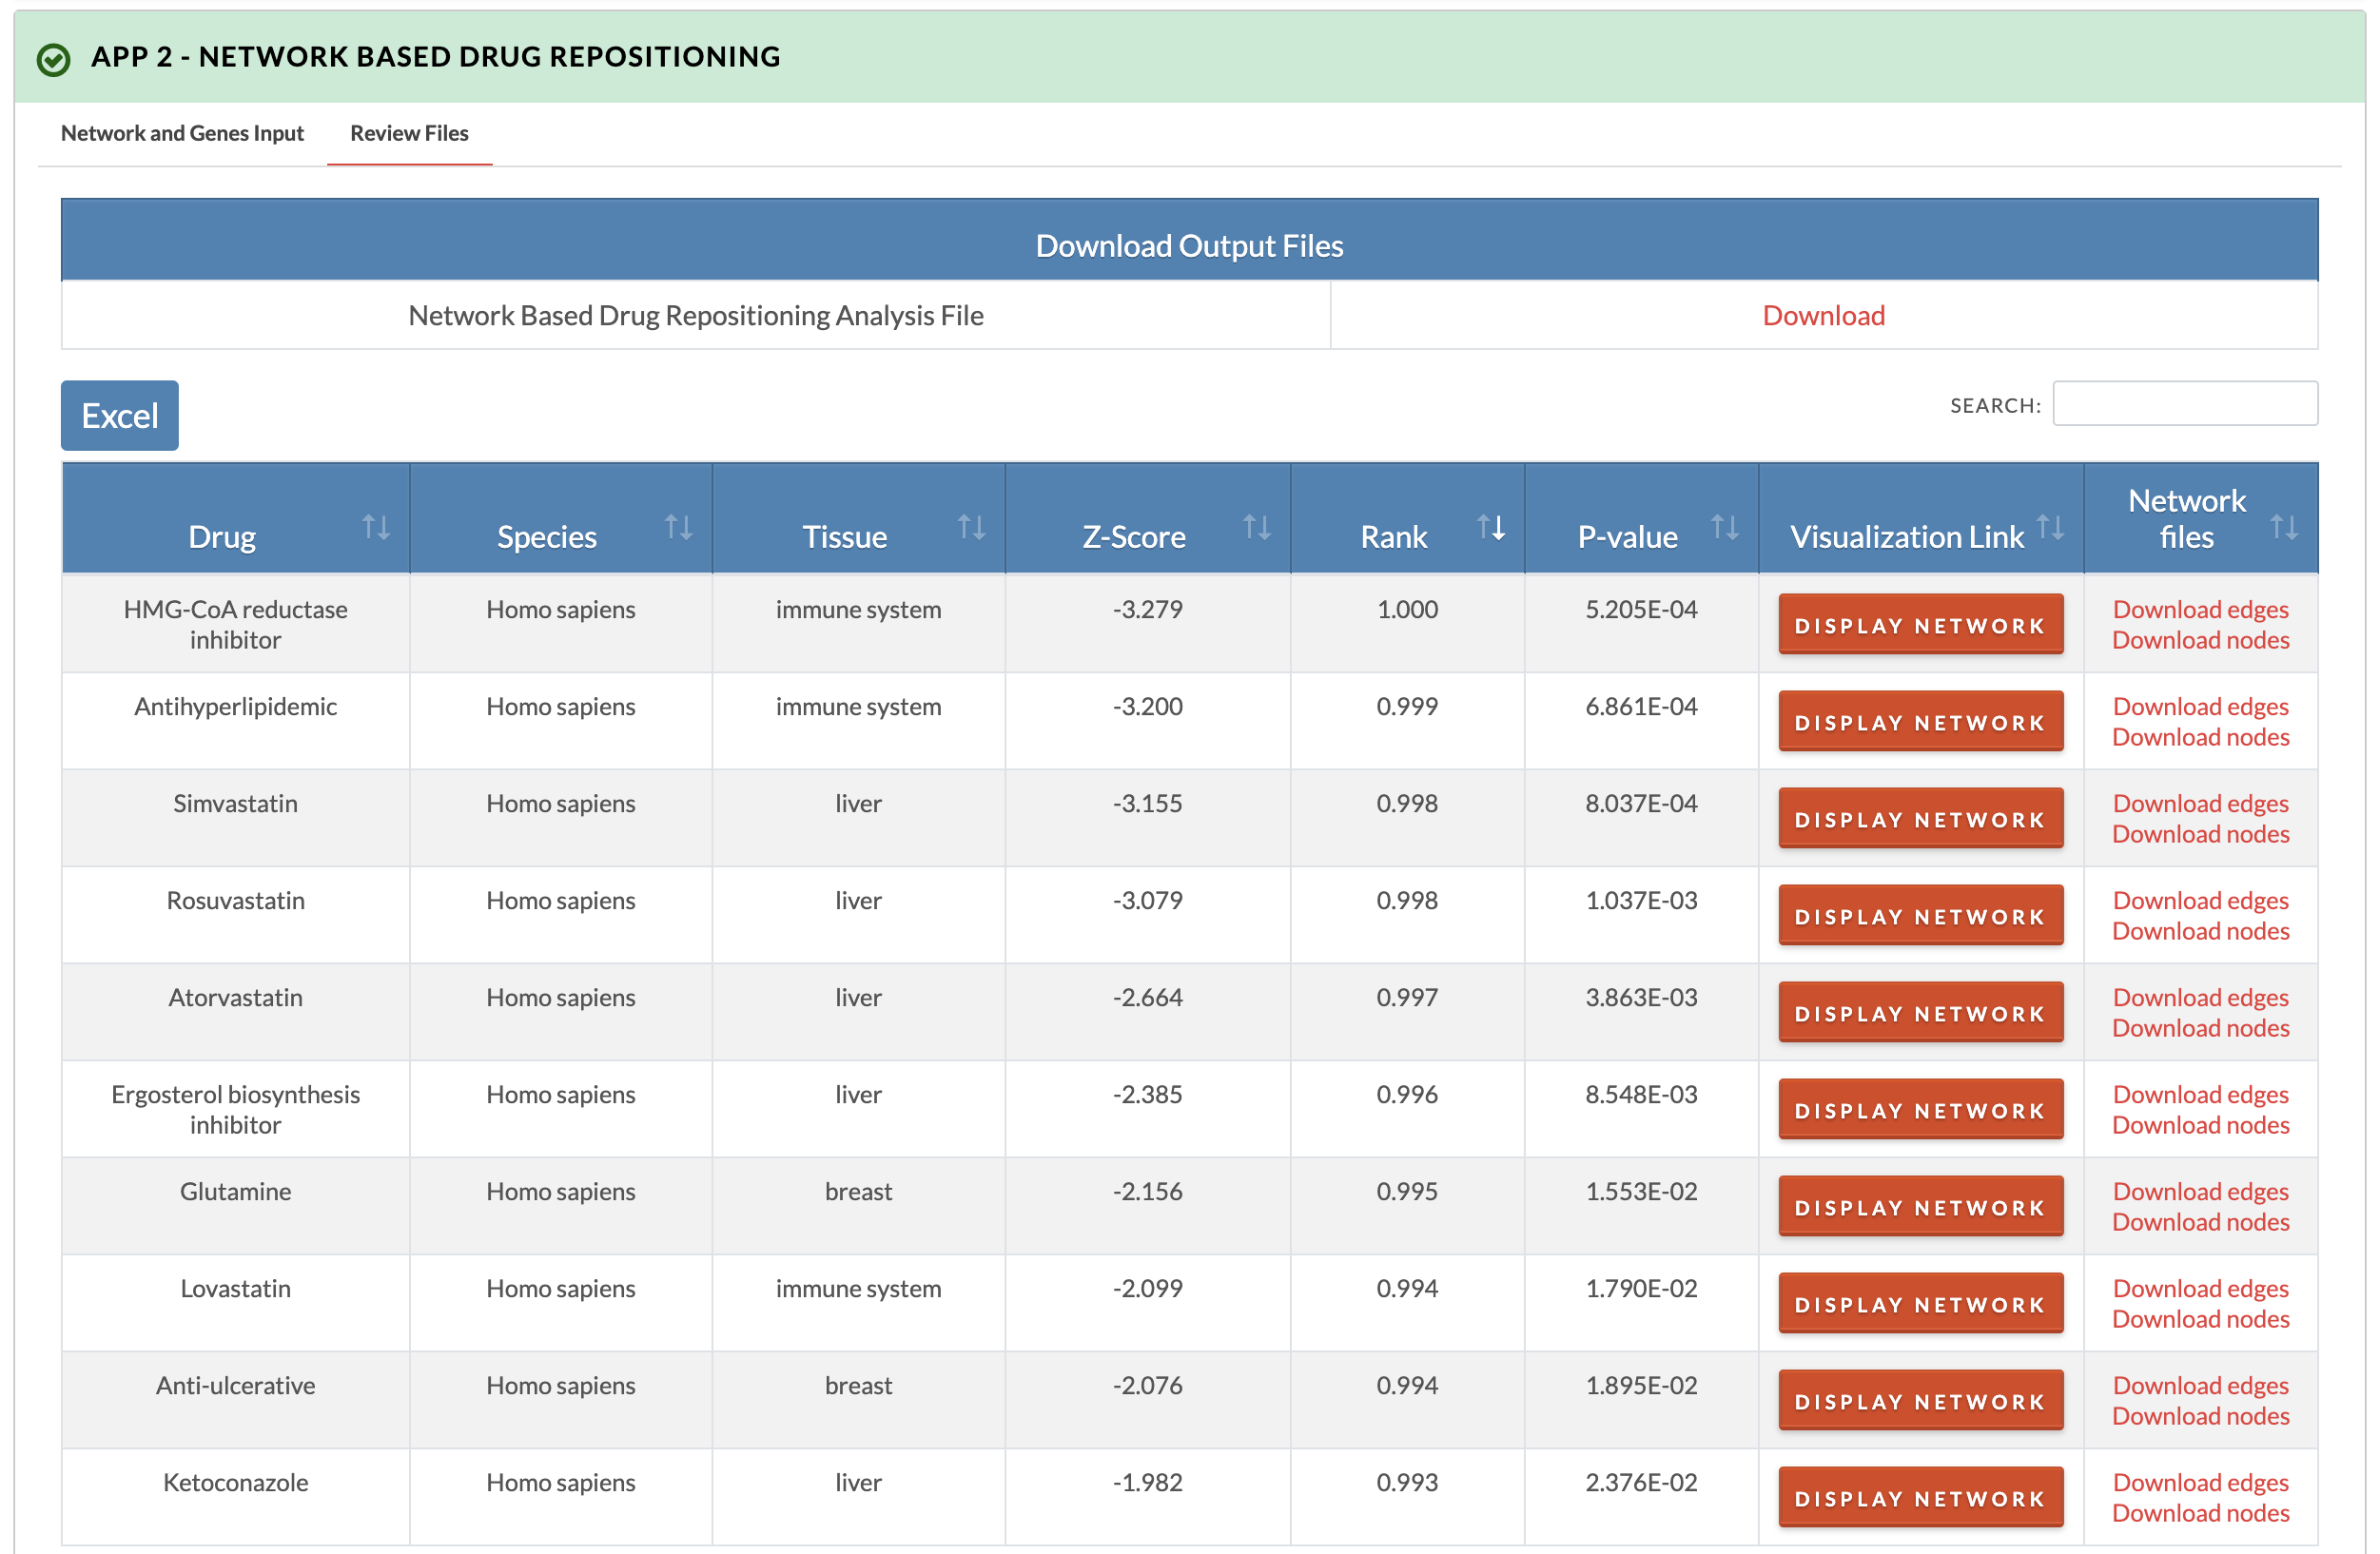
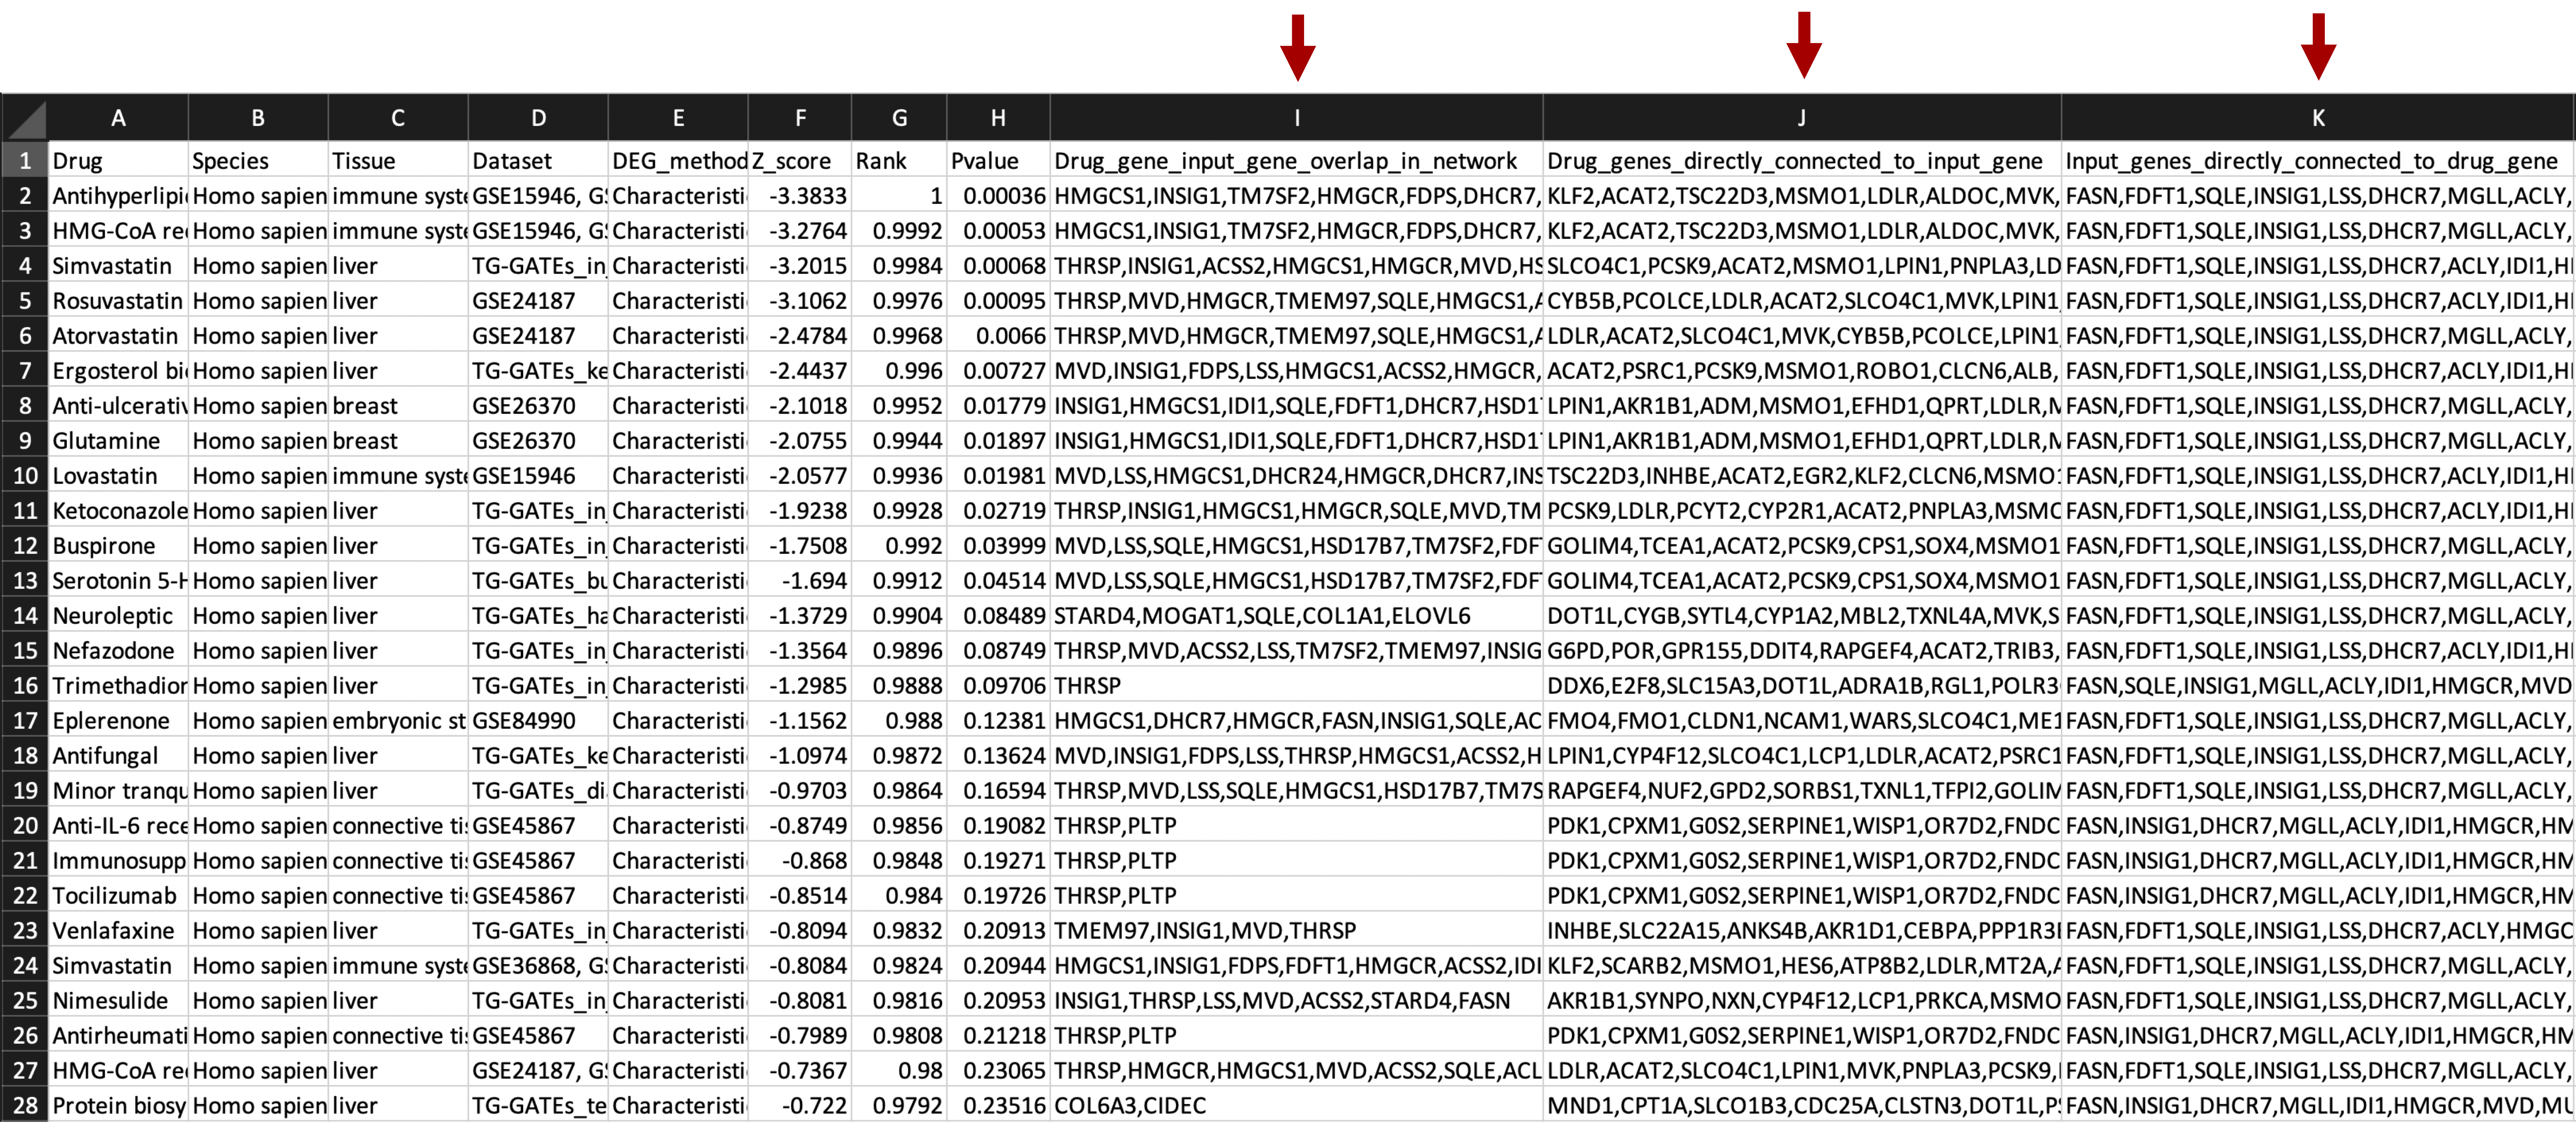
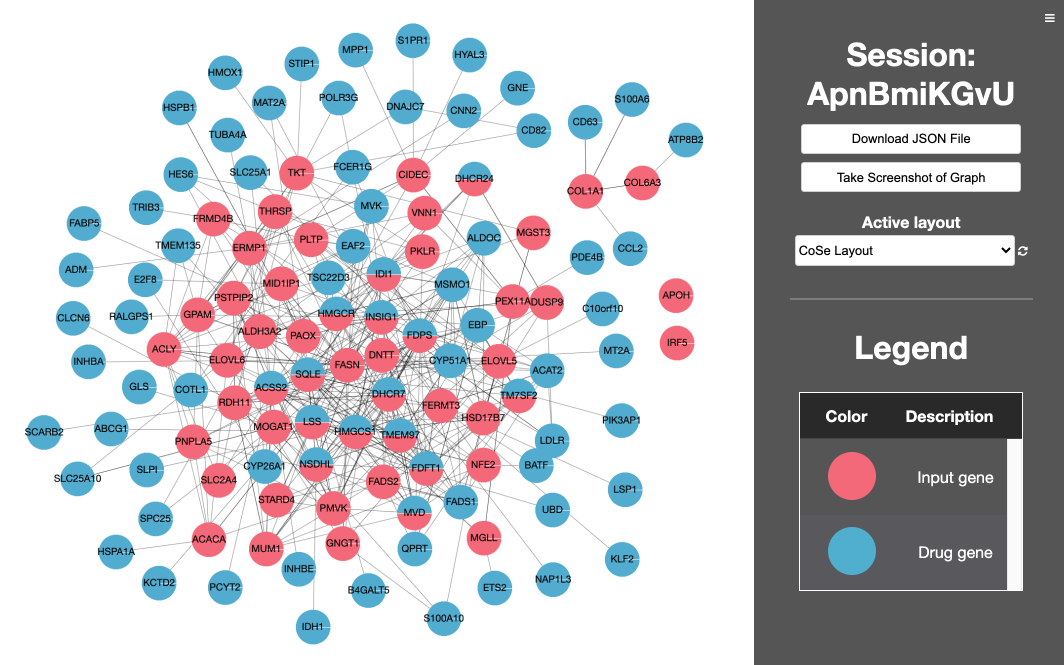
7. Retrieve results. The z-score, z-score rank, and p-values are recorded for all species- and tissue-specific signatures. In the downloadable results file, overlap between network drug genes and network input genes is in the 'Drug_gene_input_gene_overlap_in_network' column, drug genes whose first network neighbors are input genes are in the 'Drug_genes_directly_connected_to_input_gene' column, and input genes whose first network neighbors are drug genes are in the 'Input_genes_directly_connected_to_drug_gene' column. In the 'Visualization Link' column of the interactive results table, the drug gene overlap with the network and first neighbor connections to disease genes can be visualized by clicking the 'Display network' button.
Results example querying meta signatures
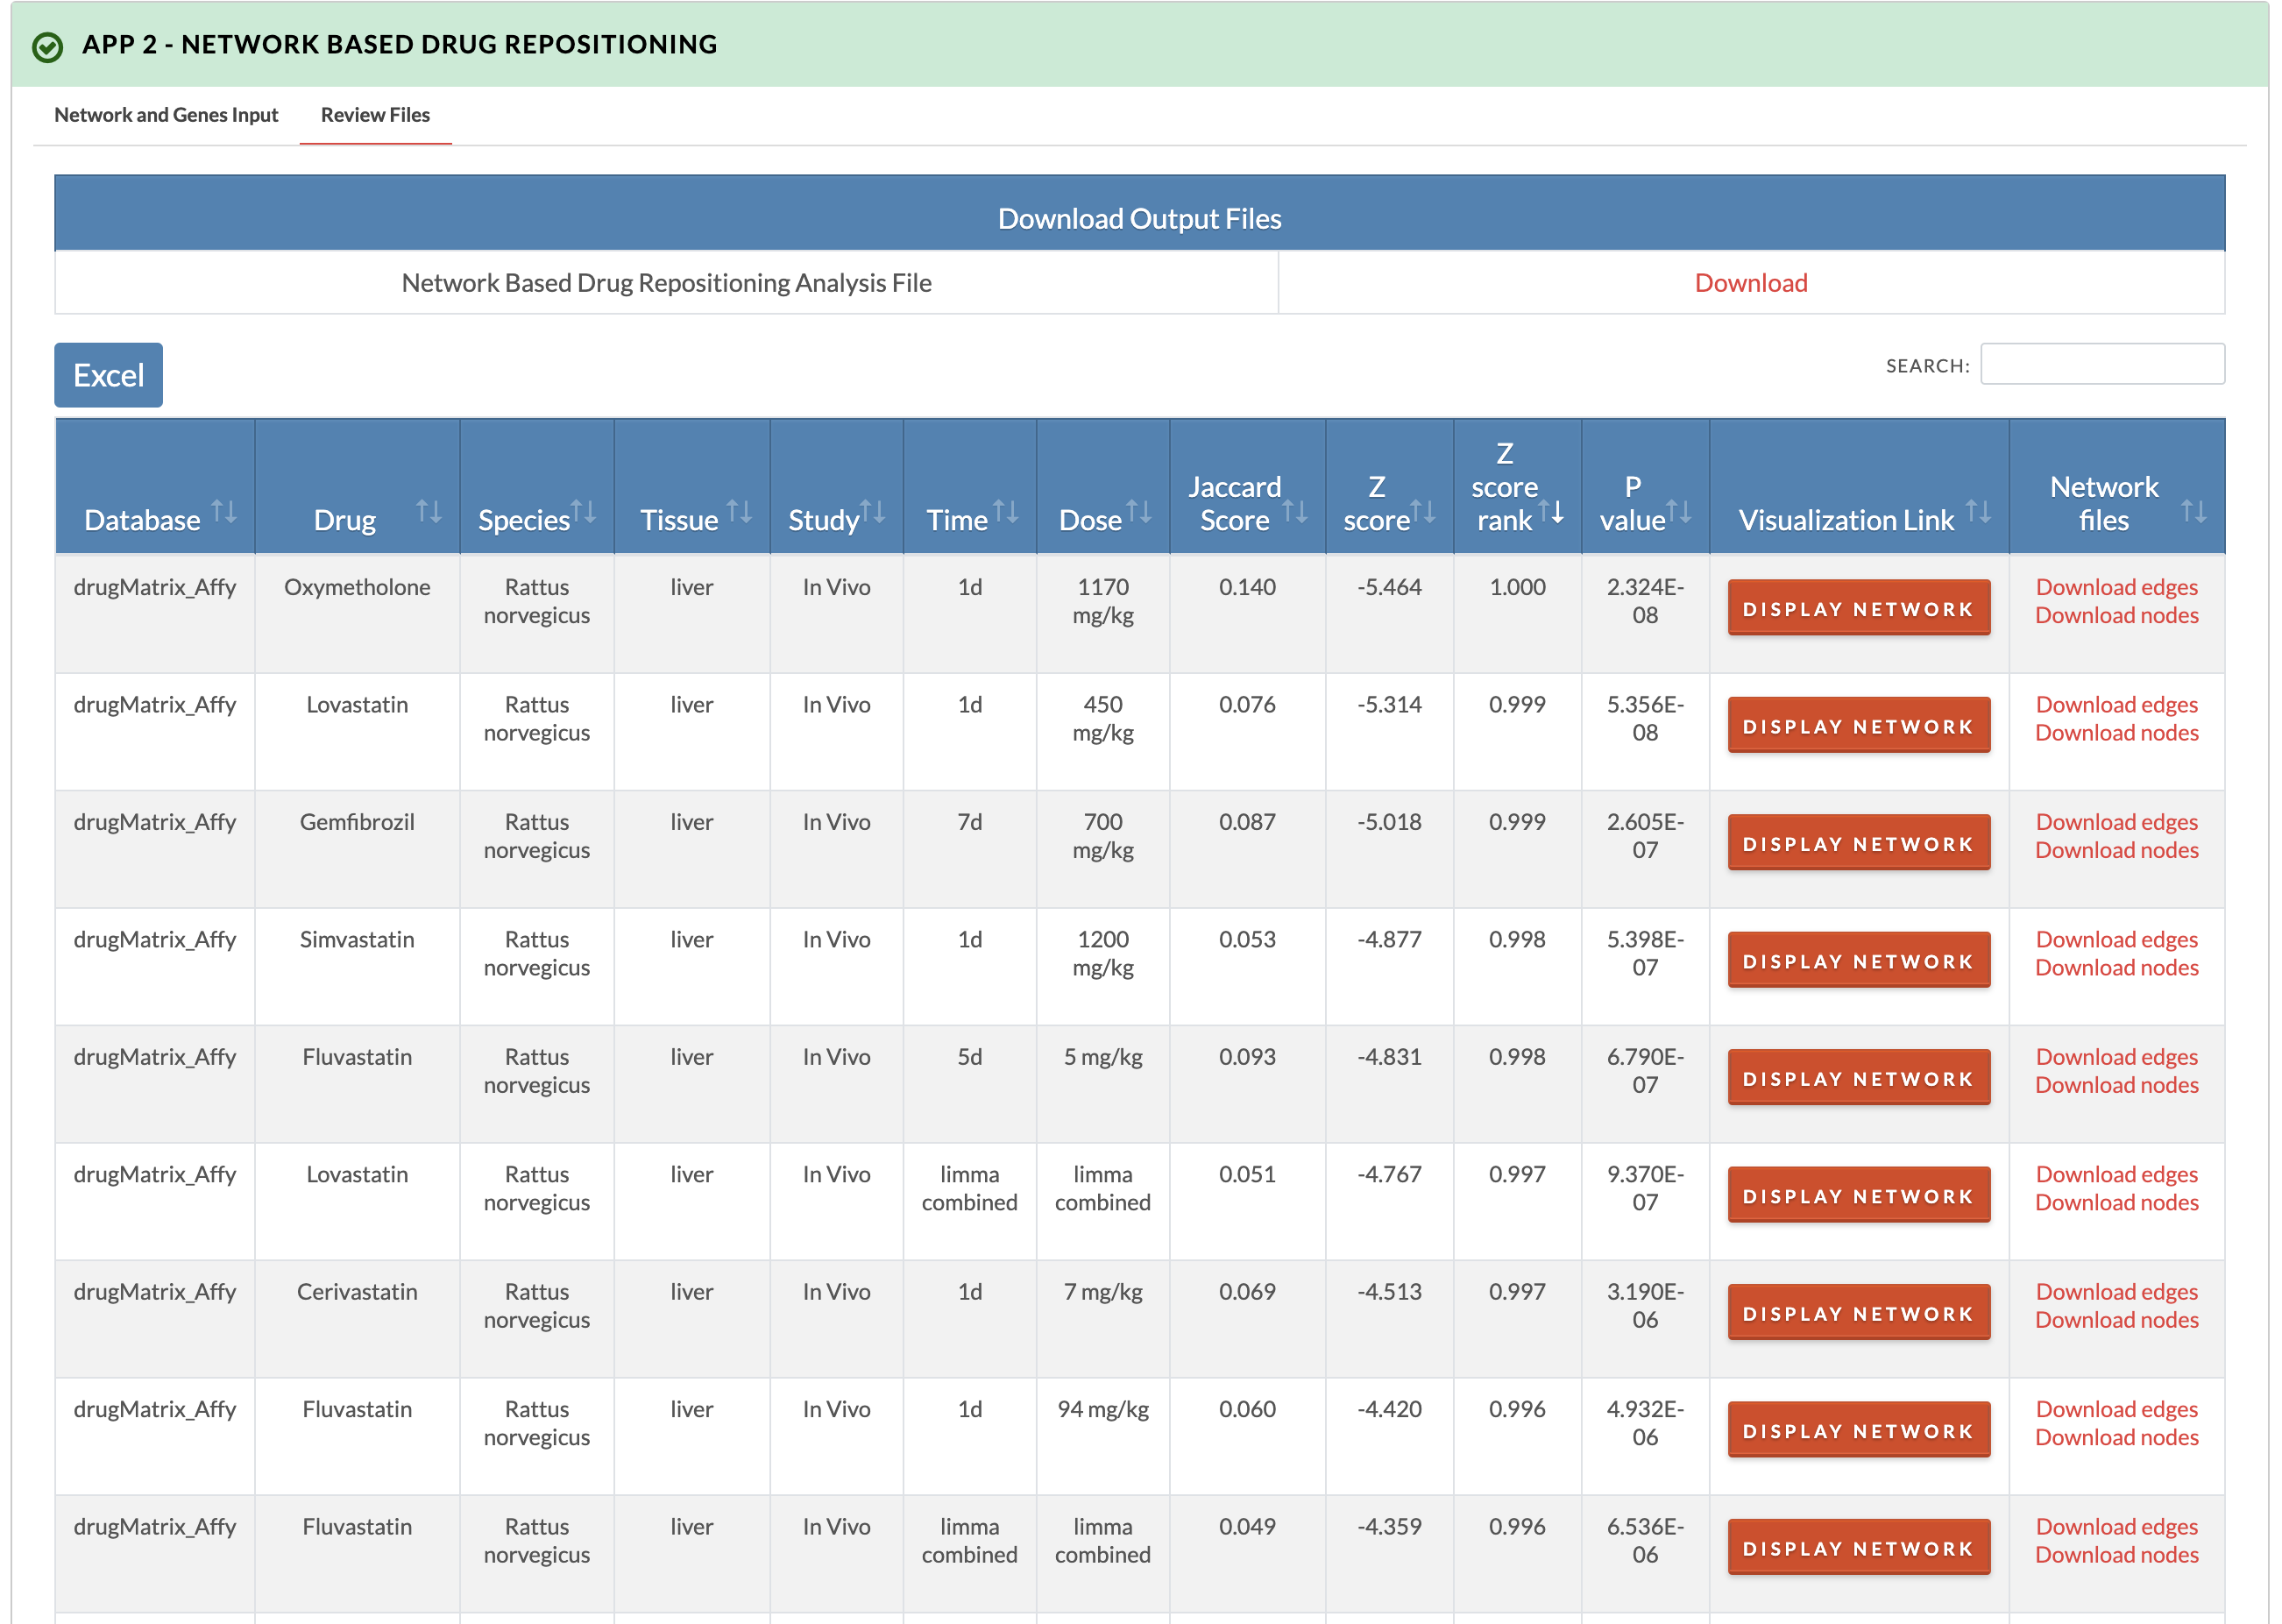
Results example querying dose segregated signatures
Additional network drug gene information columns in downloadable result file
Drug Network Visualization
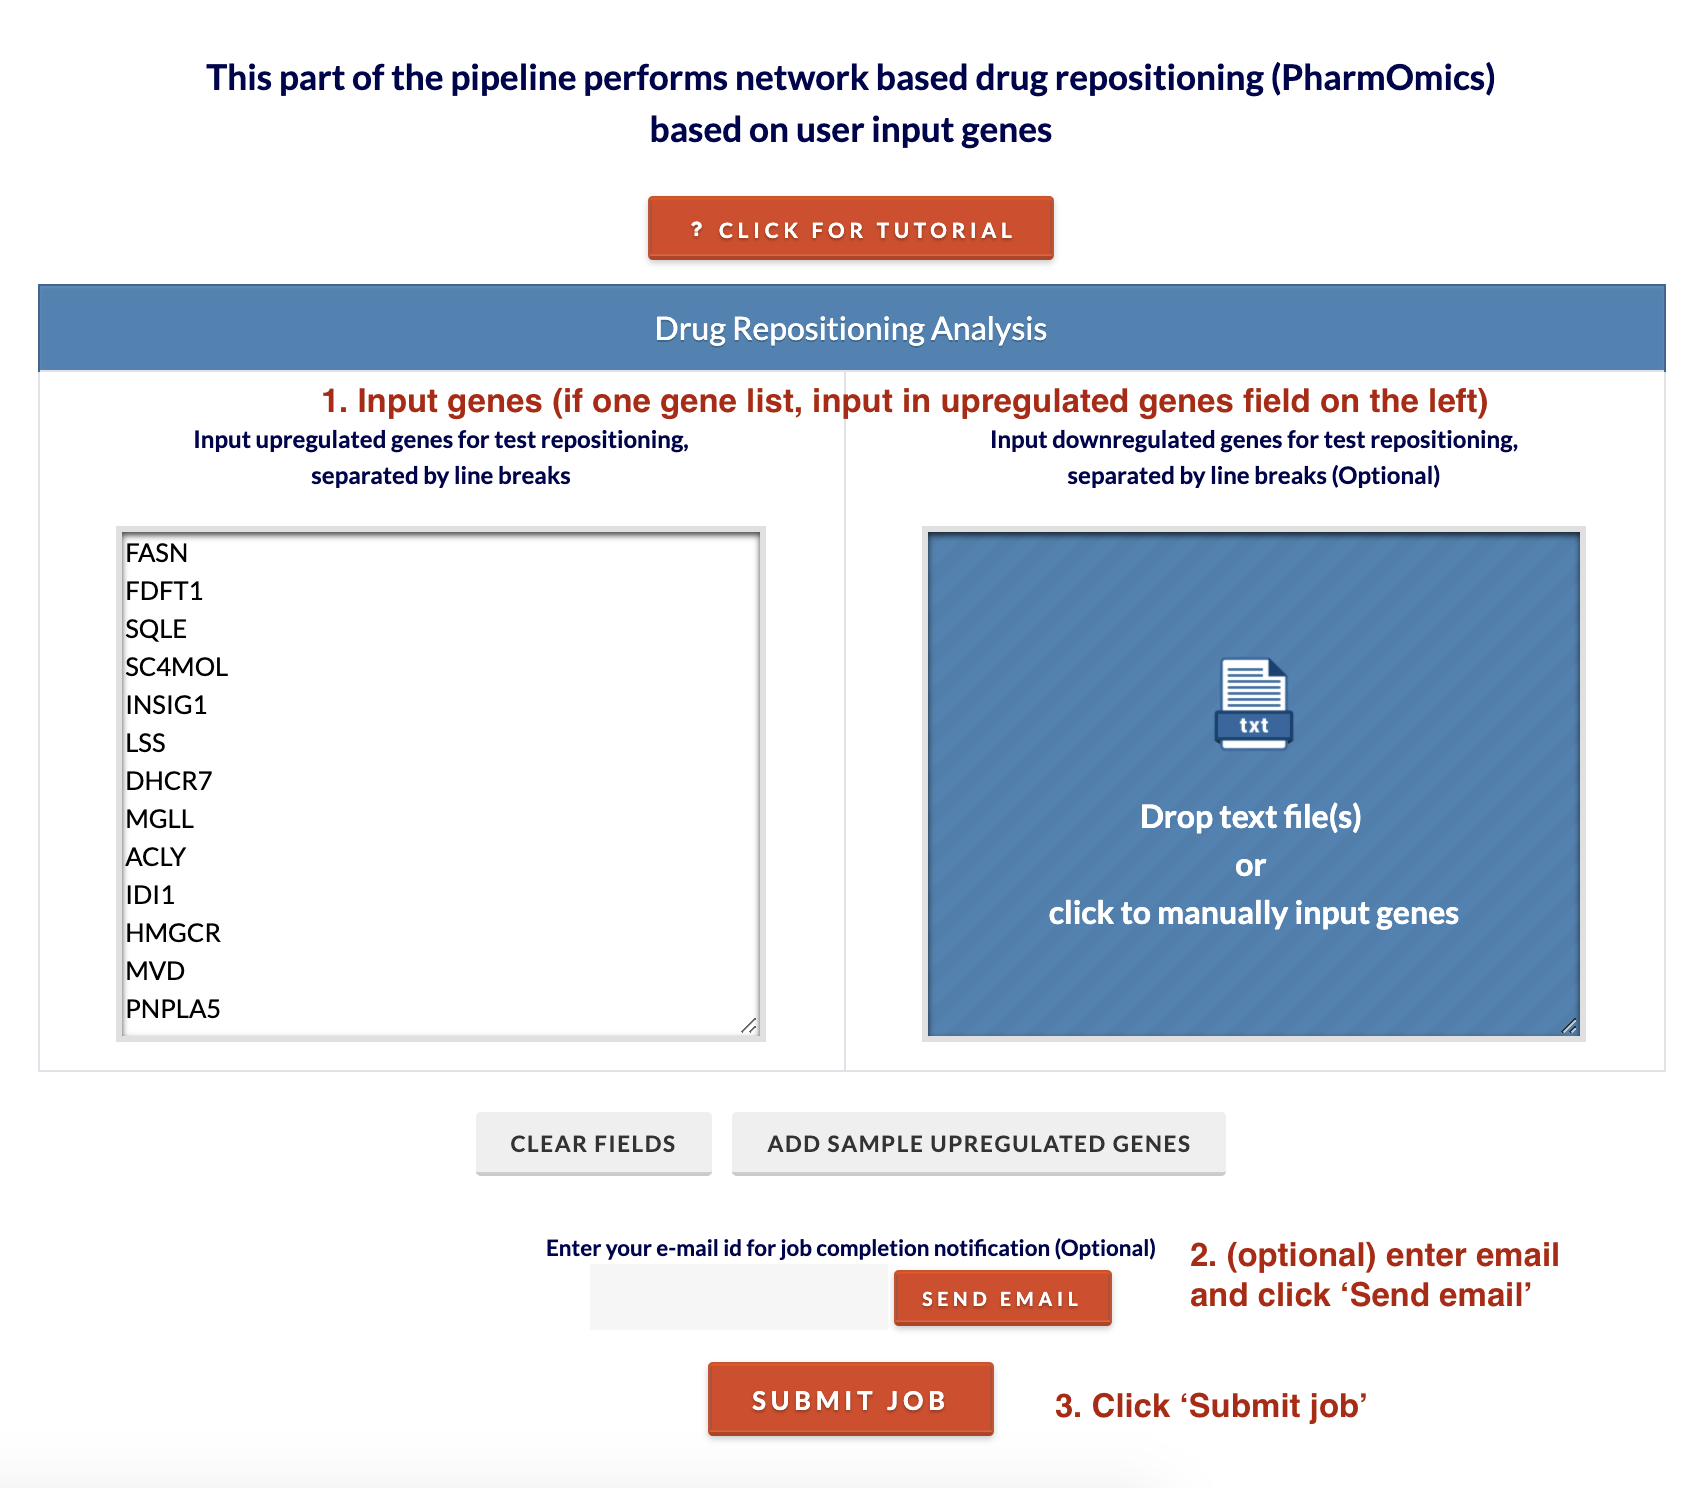
1. Input genes. Either copy and paste genes into fields or drag and drop a text file. For a single gene list, input genes onto the upregulated genes field on the left. To run the drug repositioning analysis, click 'Submit job'. The analysis will take around 5 minutes to complete. Optionally, enter email and click 'Send email' to receive results via email. If you do not receive results, the email may have been sent to spam. Alternatively, enter your session ID in the ToxiOmics home session ID prompt and the results should load if finished.
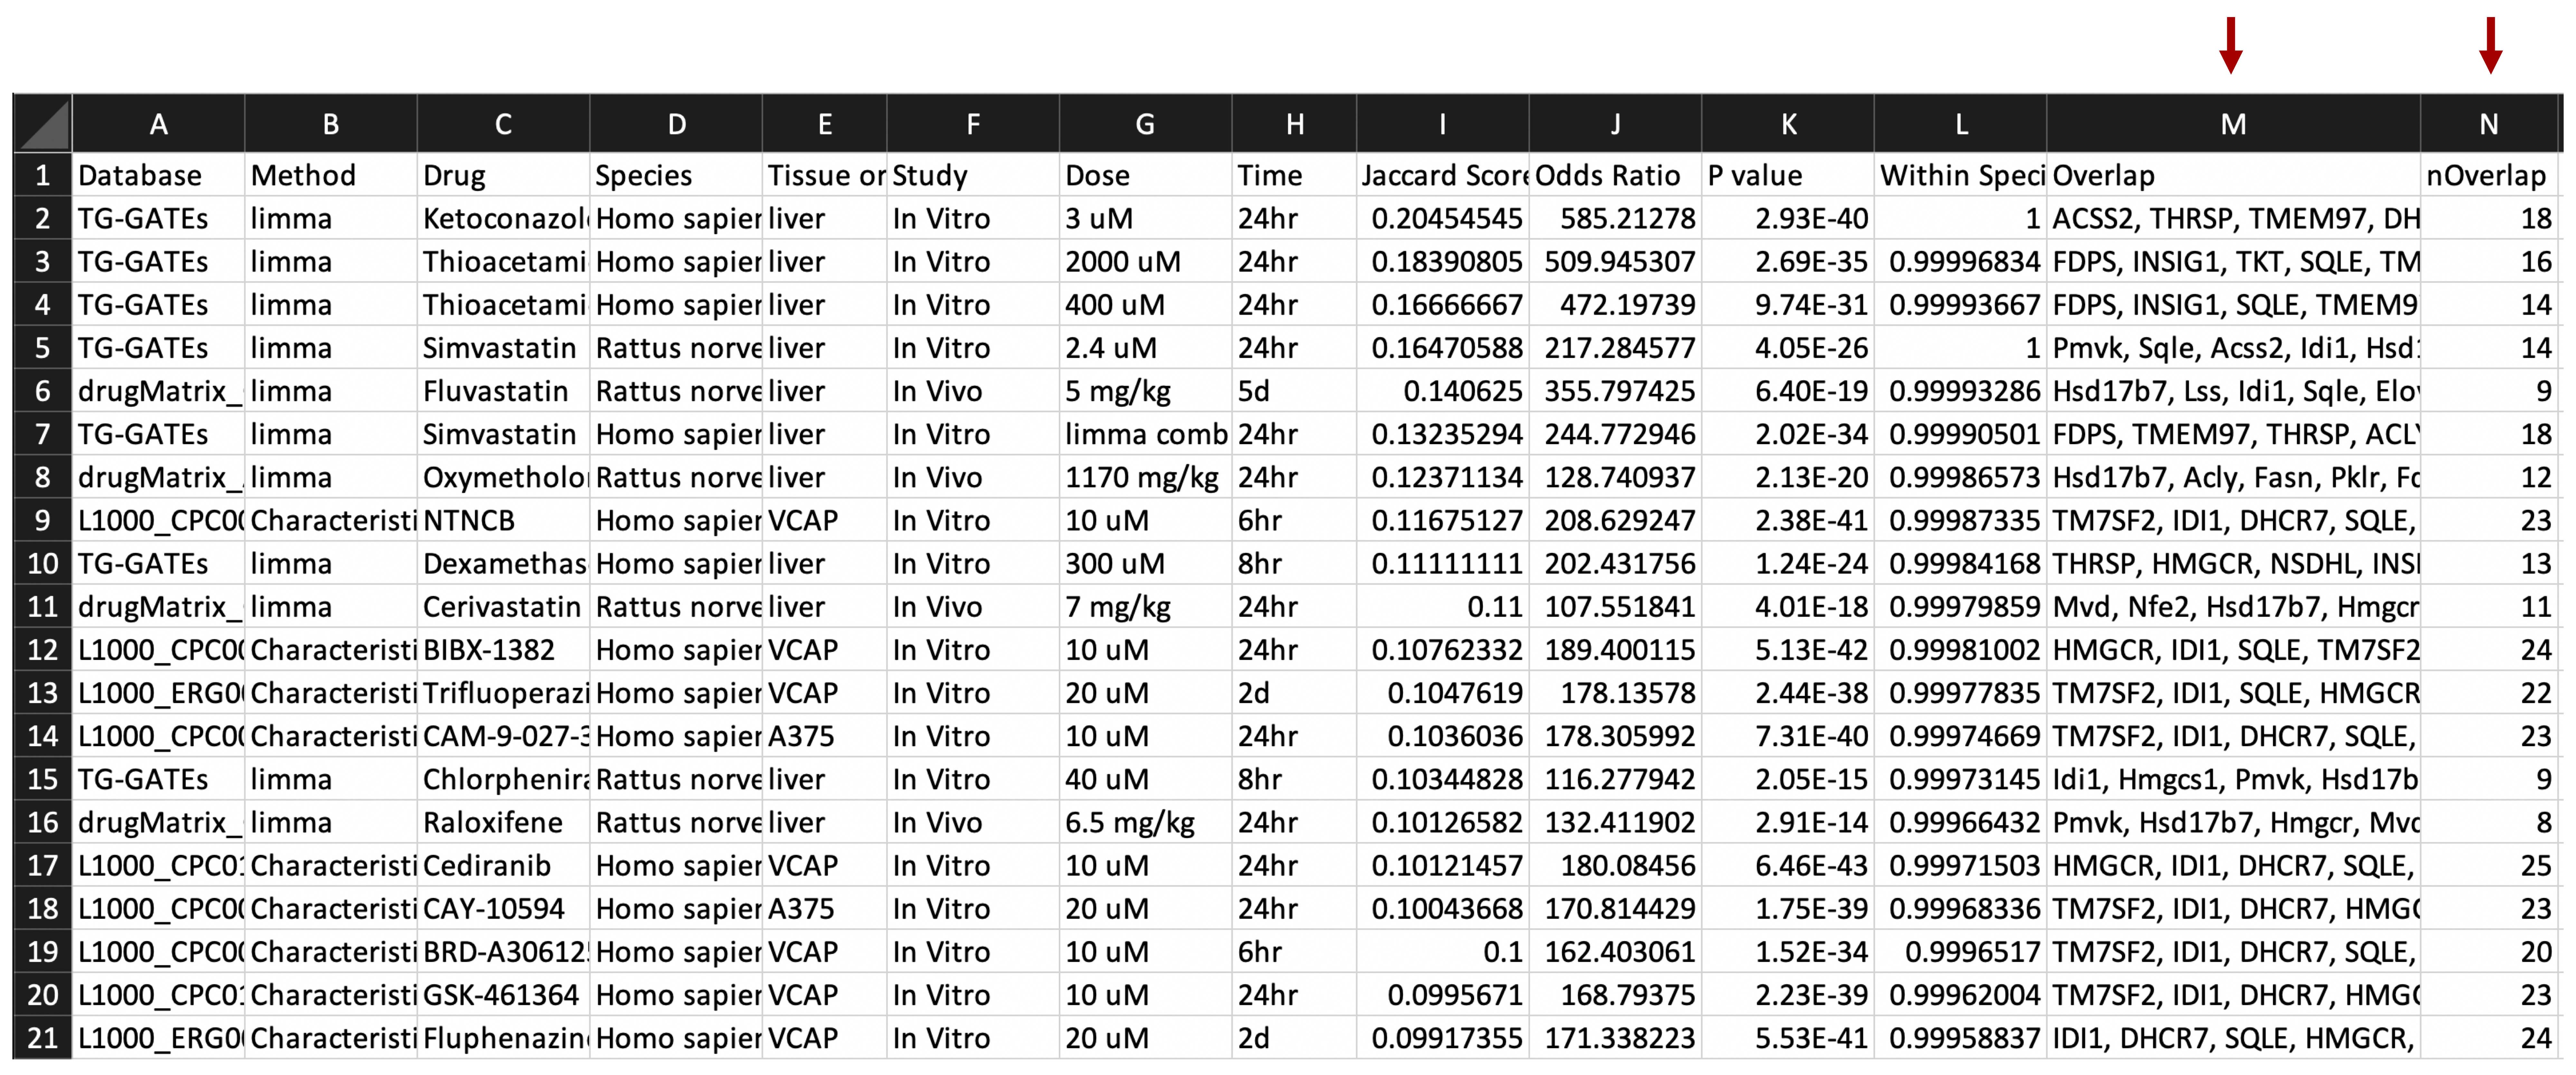
2. Retrieve results. A download link for the results will appear as well as an interactive display of the results. In the downloadable results file, additional information includes the gene overlap between drug genes and input genes.
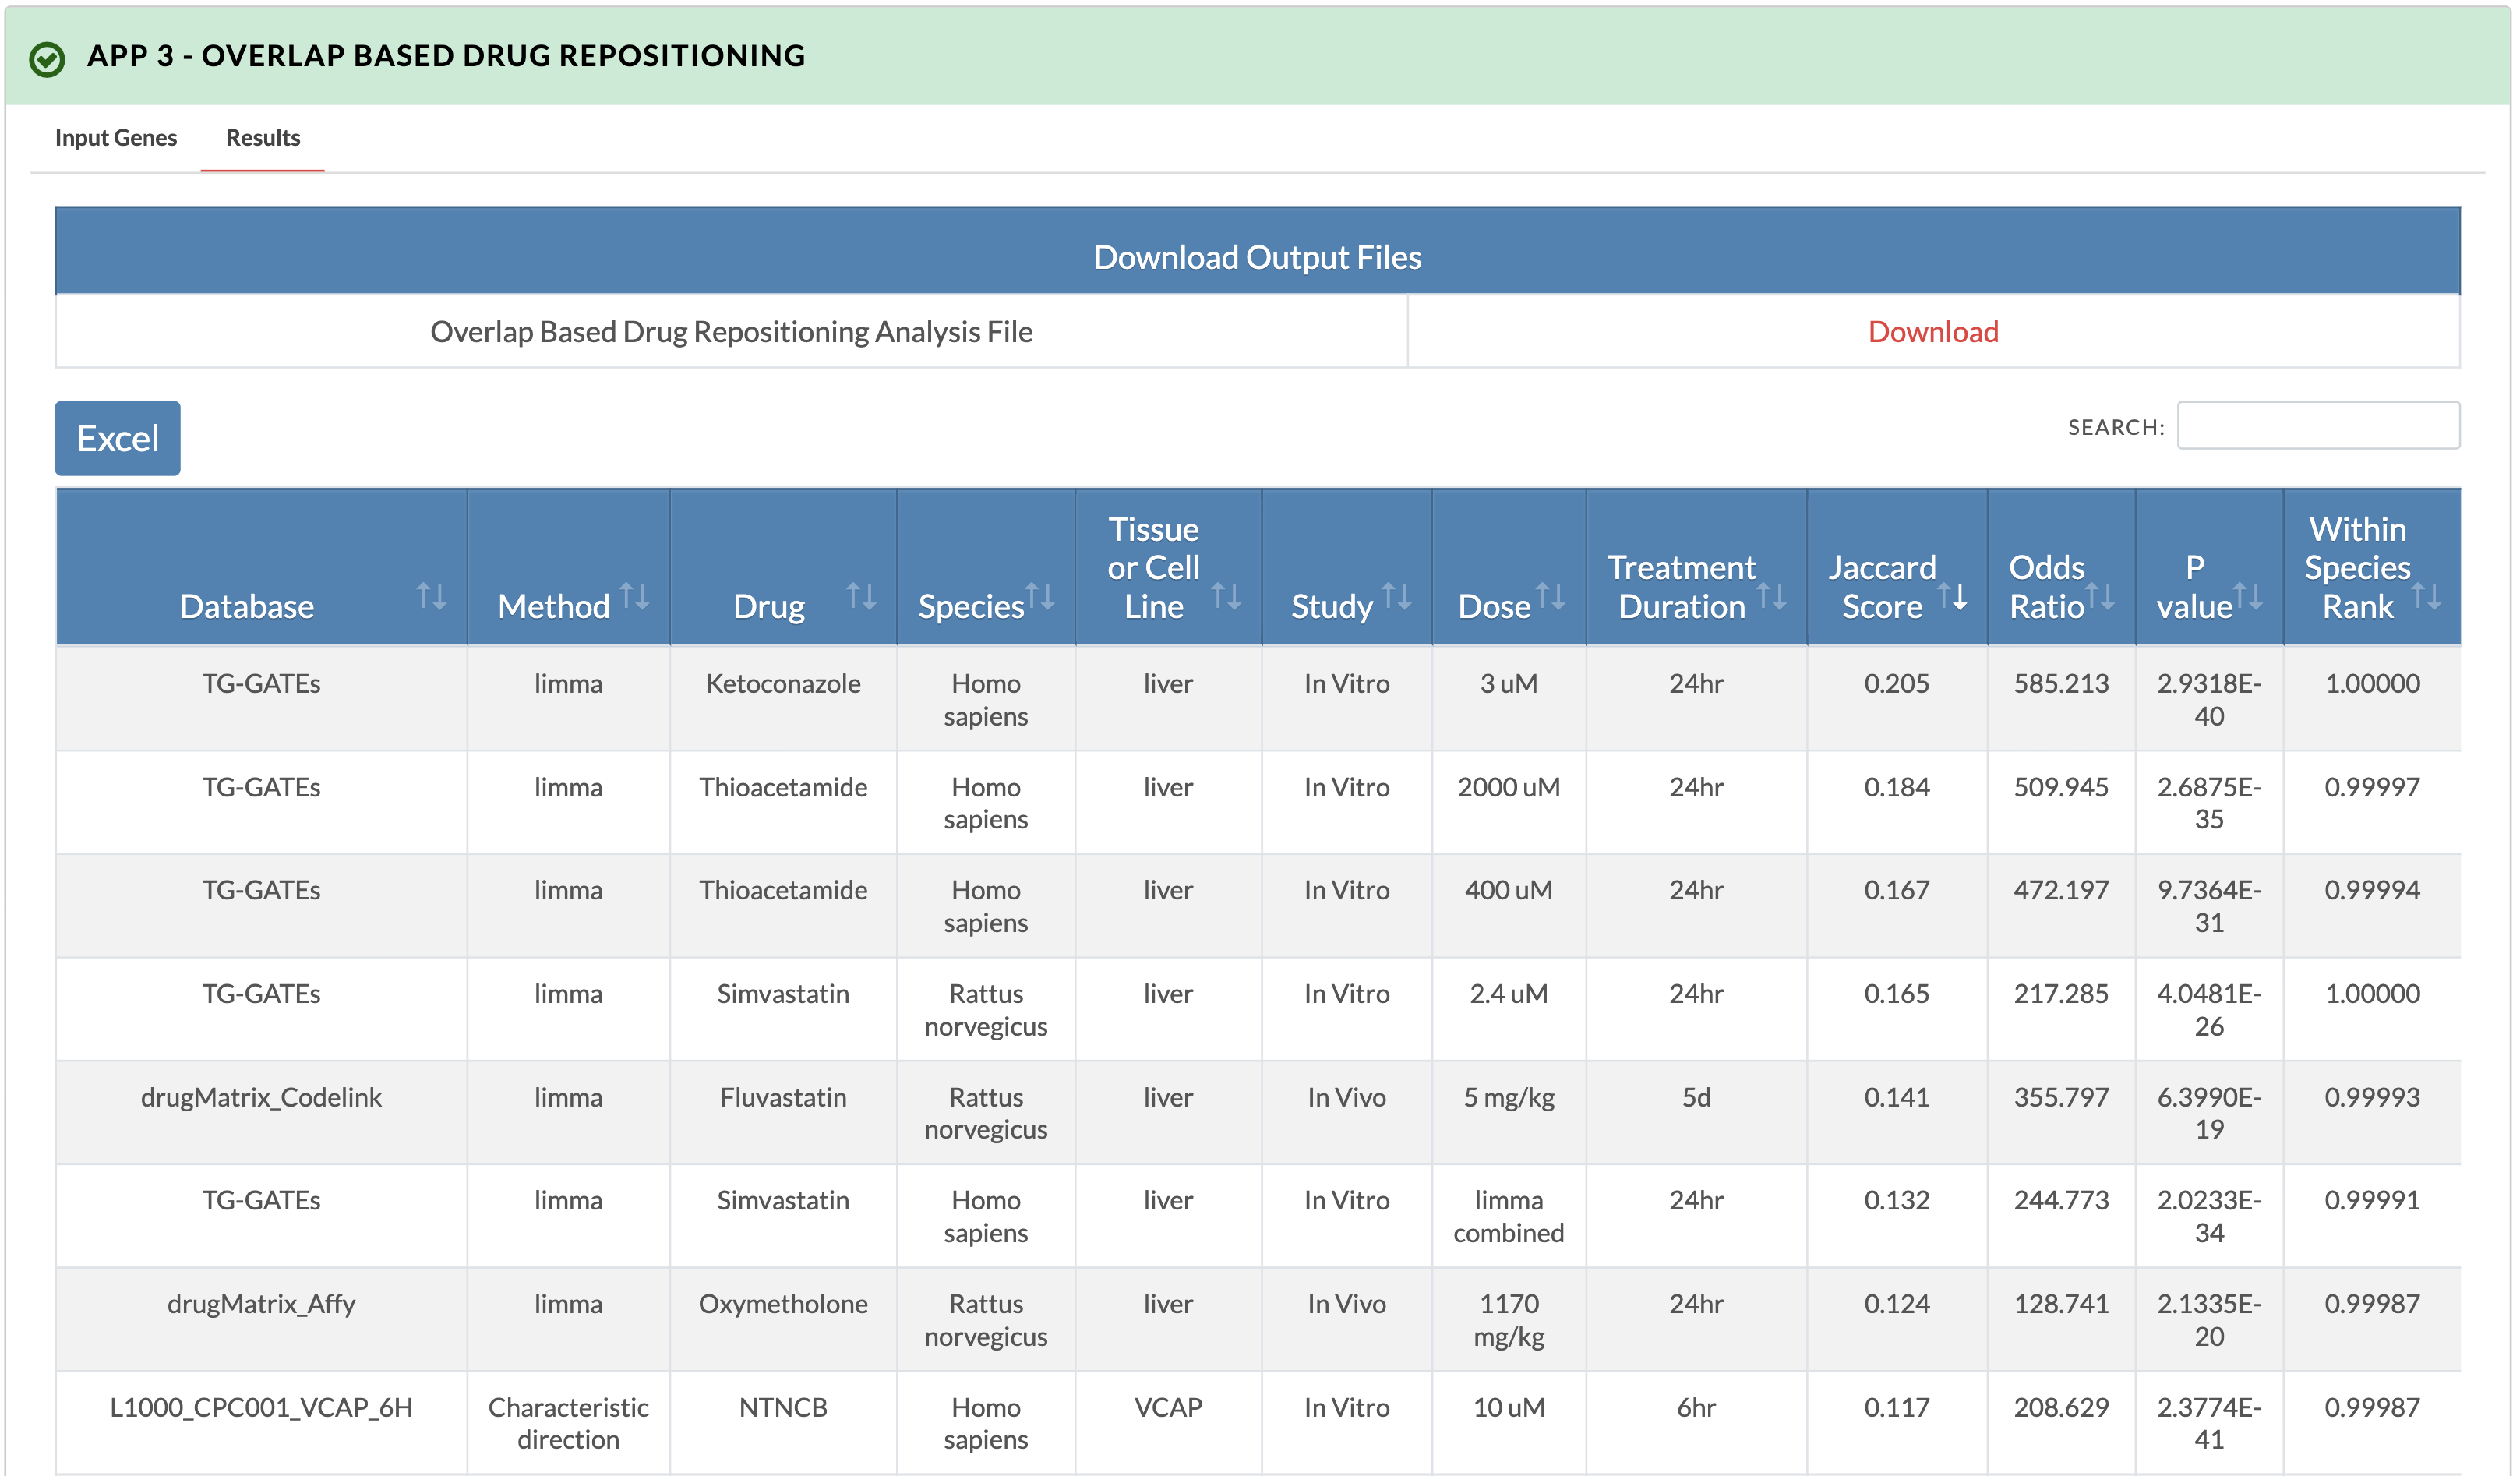
Additional gene overlap information columns in downloadable result file